
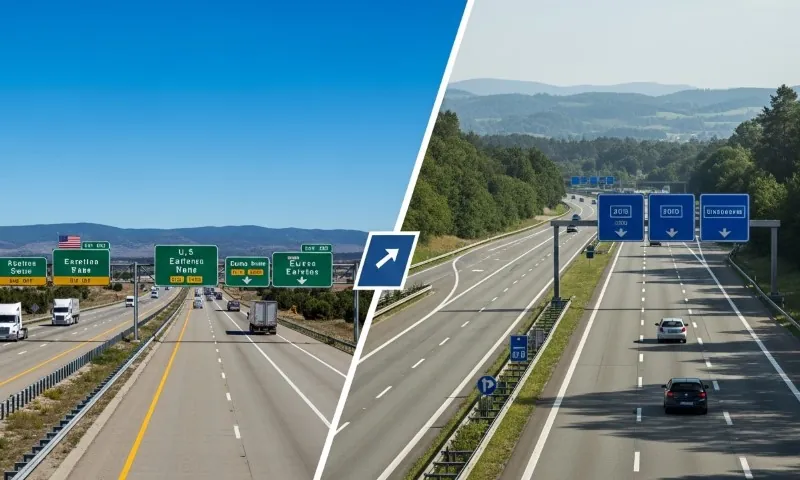
Highway systems in the United States and Europe follow different design philosophies that shape how people travel and how safe roads are.
Road geometry, lane width, and speed management all influence driver behavior, crash frequency, and injury severity.
A clear contrast exists between approaches. United States design tends to favor wide lanes and high speeds, prioritizing vehicle throughput and error tolerance.
European design focuses on narrower lanes and context-sensitive planning that moderates speed and supports multiple road users.
Evidence shows that these contrasting approaches lead to different safety outcomes.
Lane Width Design Philosophy
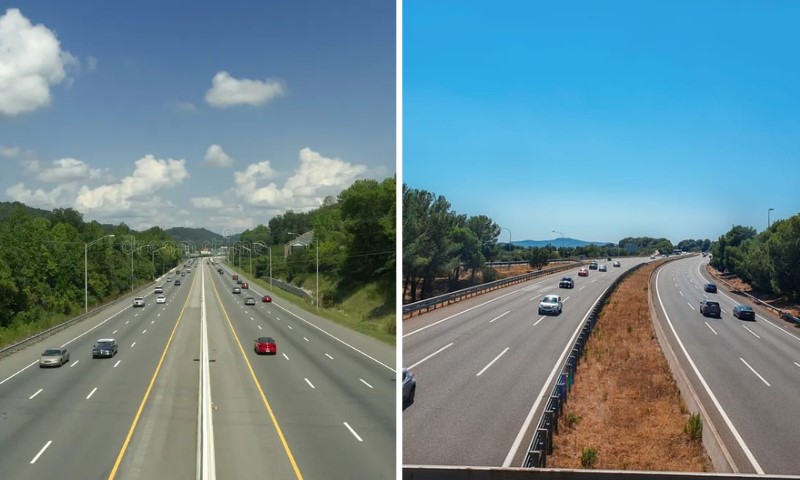
Lane width plays a central role in shaping how drivers behave, how fast vehicles move, and how severe crashes become.
Design decisions related to lane size influence not only vehicle flow but also the interaction between cars, pedestrians, and cyclists.
Differences between the United States and Europe reveal two distinct approaches to balancing speed, safety, and space.
United States Approach
Standard lane width in the United States ranges between 10 and 12 feet, with 12 feet most common on highways.
Design guidance largely follows AASHTO recommendations, which prioritize high-speed travel, accommodation of large vehicles such as trucks, and forgiving design that reduces the consequences of driver error.
Roadways are often built with additional width beyond minimum recommendations. In practice, many corridors include lanes that exceed 12 feet, with some reaching up to 16 feet. Extra width is often justified as a safety margin, yet it alters driver perception in ways that increase risk.
Research has identified several measurable effects tied to wider lanes. Key findings include:
- Streets with 12-foot lanes show higher crash rates than streets with 9 to 10-foot lanes
- A 1-foot increase in lane width can raise injury crash odds by about 38%
- Each additional foot of width increases average driving speed by roughly 1 mph
- Arterial roads with wide lanes account for about 70% of pedestrian deaths while making up only about 15% of total road mileage
Driver perception plays a major role in these outcomes. Wide lanes reduce the sense of constraint, which leads drivers to feel more comfortable traveling at higher speeds.
Increased speed raises stopping distance and impact force, both of which contribute to more severe injuries in collisions.
Large vehicle accommodation also influences design choices.
Freight movement and highway capacity needs often lead engineers to favor wider lanes even in areas where high speeds are not appropriate, particularly to support logistics operations and freight carriers such as divinetrans.com.
European Approach
European lane width standards typically fall between about 8.2 and 10.6 feet, or 2.5 to 3.2 meters.
Variation depends on context such as urban density, road classification, and historical street patterns.
Older cities with constrained layouts often reinforce the use of narrower lanes, while rural highways may allow slightly more width.
Design philosophy centers on influencing driver behavior through physical conditions rather than relying only on signage or enforcement.
Narrower lanes create a sense of enclosure that encourages drivers to slow down without requiring constant monitoring.
Street design often integrates multiple transportation modes within limited space. Available width is carefully allocated to support safe movement for all users. Common design elements include:
- Dedicated bike lanes placed within or alongside the roadway
- Wider sidewalks that improve pedestrian comfort and safety
- Transit lanes or shared-use corridors that support buses and other modes
Visual complexity also plays a role. Presence of trees, buildings close to the roadway, and active street edges increases driver awareness and reduces speed.
Narrow lanes function as part of a broader system that communicates caution through physical cues.
Behavioral response is a key outcome. Drivers tend to adjust speed based on perceived risk. Reduced lane width increases attention and lowers average speed, which directly reduces crash severity.
Speed Limits and Enforcement
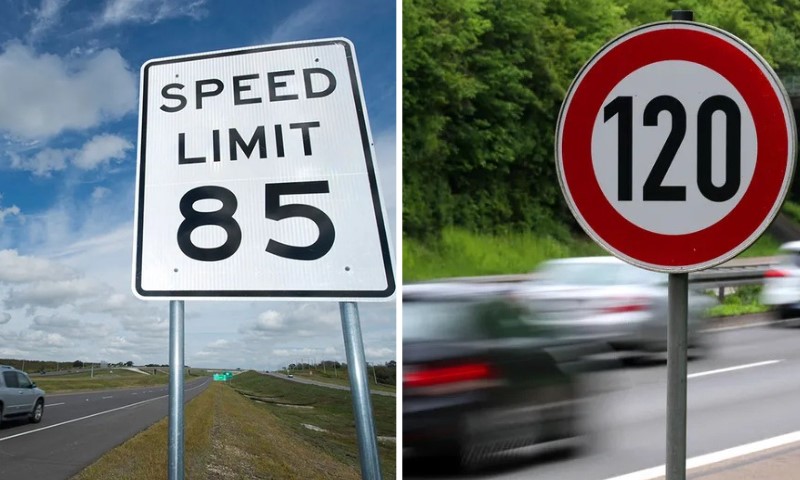
Speed management depends on more than posted numbers. Road geometry, visual cues, and enforcement methods all shape how fast drivers actually travel.
Differences between the United States and Europe show how design and policy interact to influence behavior on a daily basis.
United States
Typical highway speed limits range between 65 and 85 mph. Posted limits are often based on expected operating speeds, which are influenced by roadway design.
Wide lanes, long sight distances, and minimal roadside obstacles create conditions that encourage faster driving, even in areas where lower speeds would improve safety.
Actual driving speeds frequently exceed posted limits when road design signals that higher speeds feel safe.
Drivers tend to rely more on visual and physical cues than on signage alone. As a result, enforcement becomes the primary tool for controlling speed rather than design.
Enforcement practices vary across regions and are often inconsistent. Key characteristics include:
- Limited use of automated systems such as speed cameras
- Greater reliance on police patrols and traffic stops
- Variability in enforcement intensity depending on location and resources
Inconsistent enforcement reduces predictability. Drivers may comply in areas with visible enforcement but return to higher speeds elsewhere.
Wide roadways continue to reinforce fast driving regardless of legal limits, creating a mismatch between intended and actual behavior.
Europe
Typical highway speeds range between 120 and 130 km/h, or about 75 to 80 mph. Speed limits are supported by both enforcement and design, creating a more consistent system.
Automated enforcement plays a central role. Cameras and centralized penalty systems ensure that violations are detected and processed reliably.
Drivers are more likely to comply when enforcement is continuous rather than occasional.
Design reinforces these limits through physical and visual cues. Narrower lanes, roadside features, and active environments signal appropriate speed levels. Common reinforcing elements include:
- Speed cameras placed at regular intervals
- Roadside trees or structures that reduce the sense of openness
- Presence of cyclists, pedestrians, or transit activity near the roadway
Consistency between design and enforcement leads to predictable behavior. Drivers receive the same message through multiple channels, which reduces the likelihood of excessive speed.
Road Safety Standards and Outcomes
Safety outcomes reflect long-term decisions about how roads are planned, built, and managed.
Differences in approach lead to measurable variations in crash rates and injury severity.
United States
Infrastructure quality remains high in terms of construction standards and capacity. At the same time, crash and fatality rates exceed those of many comparable countries.
Historical priorities have focused on moving large volumes of vehicles efficiently, with safety measures often added after patterns of harm become evident.
Recent trends highlight growing risks for vulnerable users. Data points illustrate the scale of the issue:
- Pedestrian deaths have increased by about 52% in recent years
- Wide-lane arterial roads are strongly associated with fatal incidents
High-speed corridors that pass through developed areas create conditions where vehicles and pedestrians interact under unsafe circumstances.
Long crossing distances and limited visual friction reduce driver awareness, increasing the likelihood of severe outcomes.
Europe
European systems follow a proactive safety model that aims to prevent crashes before they occur.
Many countries apply Vision Zero principles, which treat fatalities as preventable rather than inevitable.
Design focuses on reducing both the frequency and severity of crashes. Multiple elements work together to achieve this goal, including controlled speeds, narrower lanes, and accommodation of different road users.
Coordination between planning, engineering, and enforcement creates a unified approach.
Lower operating speeds remain a key factor. Reduced speed lowers impact force, which significantly improves survival rates in collisions.
Integration of different transportation modes is handled in a way that minimizes conflict points and improves visibility.
Infrastructure Design and Urban Integration
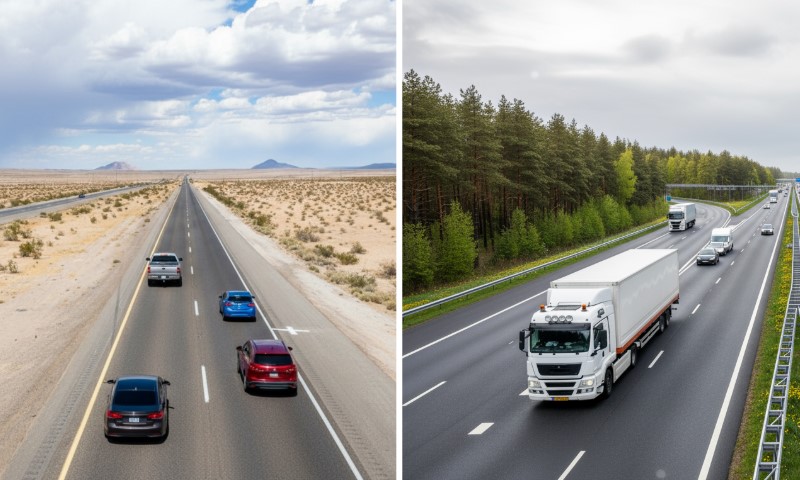
Road design shapes not only traffic flow but also how streets function within cities and communities. Allocation of space determines how easily different modes of transportation can coexist.
United States
Road networks often prioritize scale and vehicle throughput. Wide cross-sections support high traffic volumes but limit flexibility in how space can be used.
Multiple wide lanes, turning lanes, and large intersections dominate many corridors.
Available space is frequently consumed by vehicle infrastructure, leaving limited room for other uses. Consequences of this allocation include:
- Reduced or absent protected bike lanes
- Narrow sidewalks that limit pedestrian comfort
- Long crossing distances that increase exposure to traffic
Lane width plays a direct role in this outcome.
Urban streets designed with highway dimensions often struggle to support safe, active environments.
Europe
Urban roads in Europe are integrated into dense, mixed-use settings where space is limited and must be used efficiently.
Narrower lanes allow planners to allocate space across multiple functions without expanding the roadway footprint.
Street design supports safe interaction among users by balancing movement and access.
Shorter crossings, visible pedestrian zones, and dedicated cycling infrastructure improve safety and usability.
Efficient use of space allows cities to maintain mobility while supporting daily activities such as walking, cycling, and public transit use.
Lane width becomes a flexible design tool that can be adjusted based on context rather than fixed to a single standard.
Summary
United States and European highway designs follow different priorities that shape safety outcomes. Evidence shows that wider lanes do not improve safety and often increase crash severity.
Narrower, context-based designs control speed more effectively and reduce severe crashes.
Road safety depends less on size and more on how design influences human behavior.