
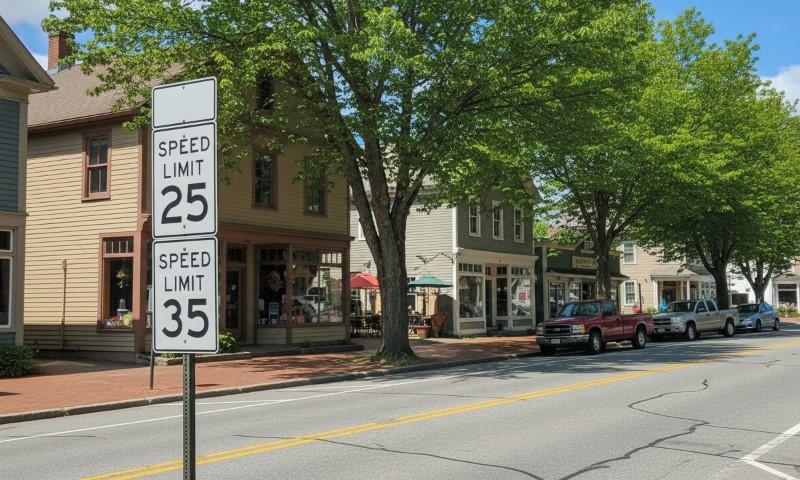
At first glance, the difference between a 25 mph speed limit and a 35 mph speed limit may seem minor.
Ten miles per hour does not feel dramatic from behind the wheel, especially on familiar neighborhood streets.
Yet decades of traffic safety research show that this small numerical change can have a profound impact on crash risk, injury severity, and whether people survive collisions.
Speed influences how often crashes occur, how severe they are, and how likely people outside of vehicles, such as pedestrians and cyclists, are to be seriously injured or killed.
In urban and residential environments, where people regularly walk, bike, cross streets, and access local destinations, the difference between 25 mph and 35 mph often determines whether an outcome is survivable or life-threatening.
Let us talk about it.
How Speed Limits Are Set
Speed limits shape how people move through streets and how safely those movements occur.
Decisions about posted speeds influence driver behavior, crash outcomes, and the daily experience of people walking, biking, or accessing nearby destinations.
Speed policy in the United States developed largely through engineering practice, with safety-focused methods gaining traction only in recent years.
Traditional Engineering-Based Speed Setting
Speed limits in the United States have historically been determined through traffic engineering studies that focus on vehicle movement rather than human injury risk.
Engineers often begin by observing how fast drivers travel under free-flow conditions, meaning times of low traffic and good weather.
Speed measurements collected under those conditions are then used to set a posted limit close to the pace of faster drivers.
A common practice involves setting limits near the speed traveled by the fastest fifteen percent of motorists.
That method assumes most drivers choose a reasonable speed and that aligning limits with observed behavior promotes compliance. Road characteristics also play a role in shaping the final number.
Key roadway features commonly evaluated include:
- Width of travel lanes and total number of lanes
- Presence and sharpness of curves
- Sight distance and visibility conditions
- Spacing and frequency of intersections
- Roadside objects, clear zones, and recovery space
- Historical crash records focused on frequency rather than severity
Such factors help assess how a road performs for motor vehicles.
Human exposure and physical vulnerability often receive less weight, particularly on streets designed decades ago for lower traffic volumes and fewer people walking or biking.
Older design standards frequently assumed limited pedestrian activity, even in places that later developed into dense residential or commercial areas.
Safety-Focused Approaches to Speed Limits
View this post on Instagram
More recent approaches shift attention toward injury prevention and human tolerance to crash forces.
Safety-focused speed setting begins with the premise that mistakes occur and that road systems should reduce the likelihood that those mistakes lead to severe harm.
Human bodies can withstand only limited impact forces, and speed directly controls how much force a crash delivers.
A safety-based framework evaluates conditions tied to injury risk rather than driver preference.
Considerations extend past pavement geometry to include who uses the street and how often interactions occur.
Critical safety considerations include:
- Physical limits of the human body during sudden deceleration
- Probability of serious injury at specific impact speeds
- Presence of children, older adults, and people using mobility devices
- Frequency of pedestrian crossings and bicycle movements
- Surrounding land use such as housing, schools, shops, and transit access
Lower speed limits become appropriate in places where traffic mixes closely with daily activity.
Road geometry may allow higher speeds, yet safety outcomes support lower limits when people frequently cross, enter, or travel alongside moving vehicles.
Relationship Between Speed and Crash Risk

Speed influences safety long before a collision occurs and continues to shape outcomes once one happens.
Changes of only a few miles per hour affect reaction time, braking distance, and physical trauma.
Risk grows rapidly as speed increases, especially in areas with frequent conflict points.
Physics and Injury Severity
Higher speeds increase both crash likelihood and injury severity. Faster travel reduces the time available to detect hazards and respond appropriately.
Braking requires more distance, and any impact releases substantially more energy.
As speed rises, several physical effects occur simultaneously:
- Reaction time consumes more roadway
- Braking distance increases at an accelerating rate
- Collision energy rises sharply due to higher velocity
A collision at 35 mph produces far more force than one at 25 mph.
Energy transferred to the human body increases dramatically with speed, and human tissue tolerates only limited force before catastrophic injury occurs.
Impacts that might cause minor injuries at lower speeds often result in severe trauma or death at higher ones.
Pedestrian and Cyclist Risk
People outside vehicles face the greatest danger as speed increases. Pedestrians and cyclists lack protective structures and absorb crash forces directly.
Injury risk escalates rapidly once vehicle speeds exceed the mid-20s.
A person struck at 25 mph has a far greater chance of survival than a person struck at 35 mph. Ten miles per hour often marks the difference between emergency medical treatment and fatal trauma.
If a serious crash does occur despite lower speeds, getting experienced legal help can be critical, consider contacting the Texas Law Dog car accident injury lawyer for advice on compensation and rights after a collision.
Evidence on Lowering Speed Limits (25 MPH vs. 35 MPH)
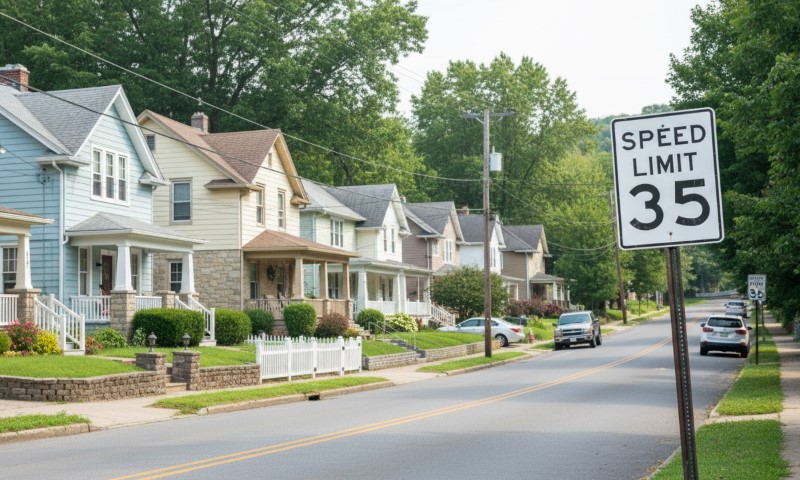
Speed limit reductions alter driver behavior and reshape crash outcomes. Even modest changes influence how fast people drive, particularly at the highest speeds that produce the most severe injuries.
Effects on Vehicle Speeds
Lower posted limits tend to reduce the number of drivers traveling at extreme speeds.
Average speeds decline modestly, yet reductions at the upper end of the speed range generate substantial safety benefits.
Observed changes commonly include:
- Fewer drivers exceeding 35 mph
- Narrower speed distributions
- Declines in the most dangerous speeding behavior
Small shifts in average speed lead to large reductions in severe crashes because the highest speeds account for a disproportionate share of fatalities.
Effects on Crash Outcomes
Urban areas that reduce speed limits consistently report fewer serious injuries and fatalities. Changes in severity often outpace changes in total crash counts.
Documented outcomes include:
- Fewer crashes resulting in injury
- Lower odds of fatal or life-altering trauma
- Reduced likelihood of pedestrians being struck at deadly speeds
Lower speeds do more than prevent collisions. Reduced impact forces make crashes less deadly when they occur.
Broader Public Health and Safety Benefits
Lower speed environments support safer walking and biking, increased physical activity, and improved neighborhood access.
Reduced speeds also lower noise levels and stress, contributing to healthier daily conditions for residents.
Why 10 MPH Makes a Big Difference

Ten miles per hour may appear minor on a speedometer, yet physics and human biology treat that change as substantial. Crash outcomes respond sharply to small increases in speed.
Exponential Increases in Injury Risk
Injury risk does not rise evenly as speed increases. Kinetic energy grows rapidly, magnifying trauma.
Consequences of higher impact speeds include:
- Greater force transferred to the body
- Reduced effectiveness of seatbelts and airbags
- Rapid decline in survivability
Thirty-five mph is not simply slightly faster than 25 mph. That increase often shifts a crash across a threshold where survival becomes unlikely.
Reaction Time and Stopping Distance
Higher speeds consume space quickly. Each second of reaction time covers more distance, leaving less room to stop.
At 35 mph, vehicles travel roughly half again as far per second compared to 25 mph. That added distance frequently prevents drivers from stopping in time when a pedestrian enters a crosswalk or a cyclist moves to avoid a hazard.
Community Context and Vulnerability
Residential streets and commercial corridors host frequent interactions between vehicles and people. Conflict points occur regularly near homes, schools, parks, transit stops, and storefronts.
Conditions common in such areas include:
- Frequent crossings and turning movements
- Presence of children and older adults
- High likelihood of unexpected actions
Speed limits set at 25 mph align more closely with human safety limits in these environments. Limits set at 35 mph exceed what human bodies can reliably tolerate.
Policy Implications and Implementation Challenges
@imjoshfromengland2 AMERICAN’S DON’T MESS ABOUT MATE!!! ??
♬ Monkeys Spinning Monkeys – Kevin MacLeod & Kevin The Monkey
Speed policy reflects choices about risk, convenience, and public well-being. Lower limits raise questions about mobility, enforcement, and public acceptance, yet evidence consistently favors safety gains.
Balancing Safety and Mobility
Concerns about travel time often surface during discussions of lower speed limits. Urban travel rarely occurs at free-flow speeds due to signals, congestion, and turning movements.
In practice:
- Time savings at higher limits are minimal
- Delay often stems from intersections rather than speed limits
- Injury prevention benefits outweigh marginal time differences
A small reduction in travel time does not justify increased injury and fatality risk.
Enforcement and Street Design
Posted limits alone cannot control speed. Road design must support intended behavior.
Effective speed management relies on:
- Lane widths and curb design that discourage speeding
- Traffic calming measures such as raised crossings and curb extensions
- Clear signage paired with consistent enforcement
Streets built for 25 mph naturally encourage compliance.
Public Understanding and Acceptance
Support for lower speed limits grows as people recognize safety impacts and tradeoffs.
Clear communication strengthens acceptance by showing:
- How survival rates change with speed
- How little travel time is gained at higher limits
- How lower speeds protect children, seniors, and neighborhoods
Widespread safety improvements depend on shared awareness of how speed shapes outcomes.
Summary
The difference between 25 mph and 35 mph is not trivial. It is a dividing line between safer streets and significantly higher risk.
A 10 mph increase dramatically raises crash severity, reduces reaction time, and sharply lowers survival rates, especially for pedestrians and cyclists.
Lower speed limits save lives, reduce serious injuries, and create safer, healthier communities.